

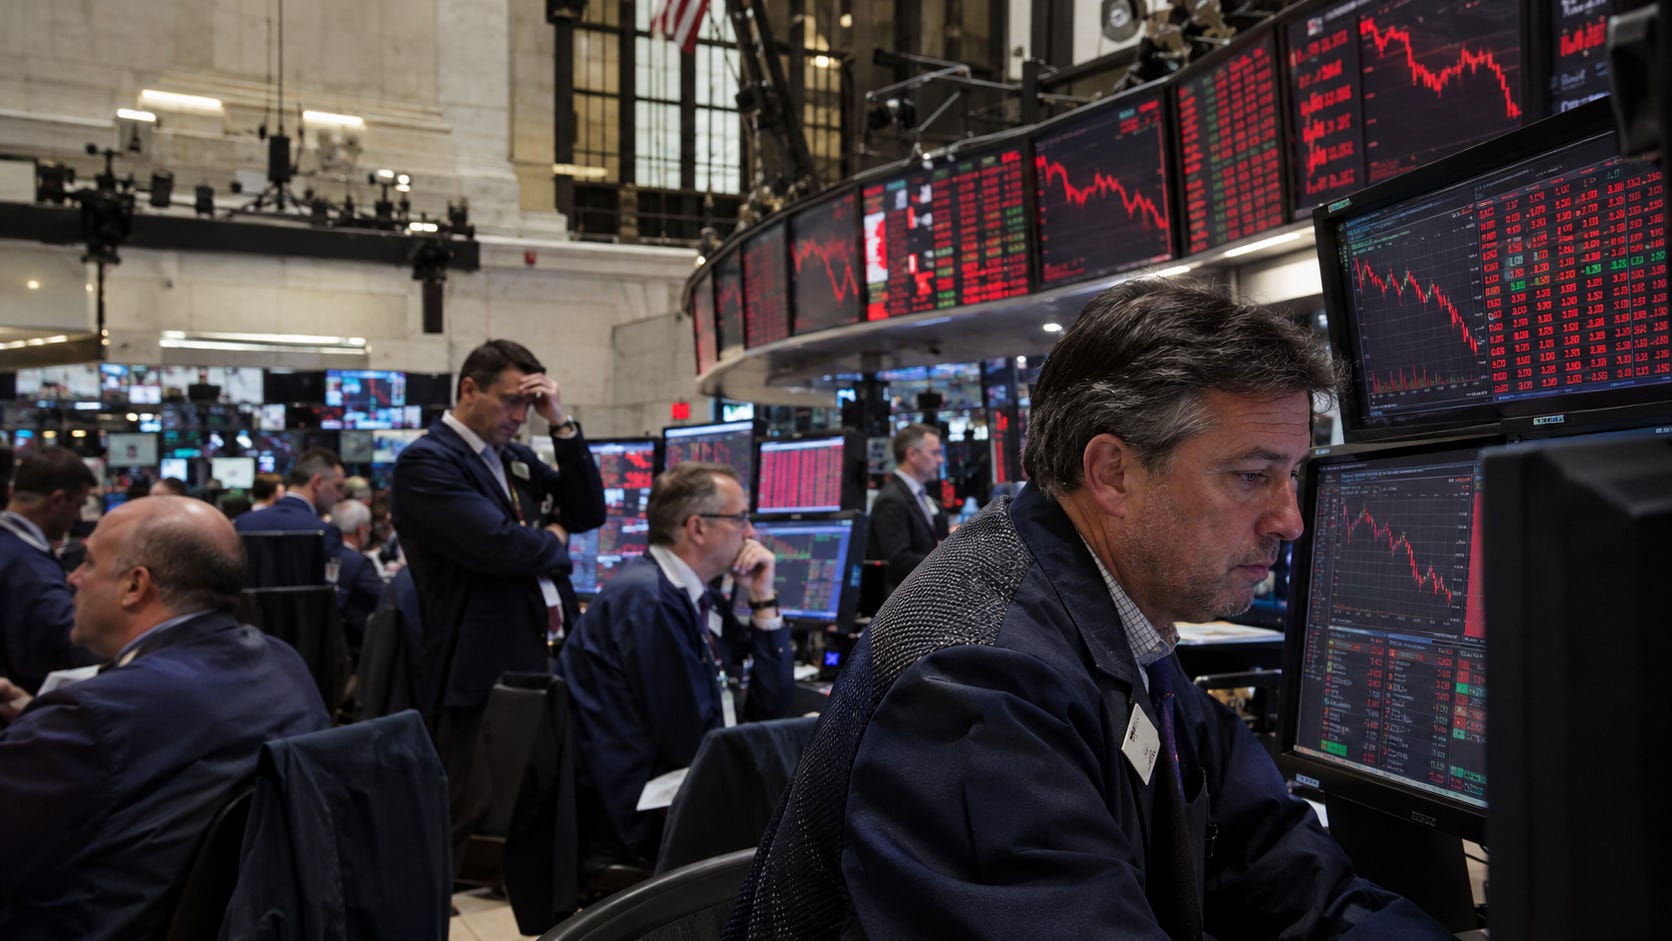
Stocks are down. Precious metals are down. Crypto is down. Nvidia is still falling.
It’s not nice to see. But I bought today.
So here are the numbers, then why it is all happening together. After that, every trade I made today and my plan from here.
The numbers
S&P 500: down 11% from its October high.
7 losing days in a row: the S&P 500 is on course for its longest run of falls since February 2020.
Nasdaq: down 20% from its October high. Its gain for 2026 is gone.
Dow: down about 6% this week, on pace for its worst week since April 2025.
Nvidia: down about 12% today to $129, its lowest since May 2025.
Bitcoin: under $60,000 for the first time since July, with a low near $58,700.
Gold: as low as $3,515, a 14-month low and about 37% below January’s record.
Silver: around $41, about 66% below its January peak near $121.
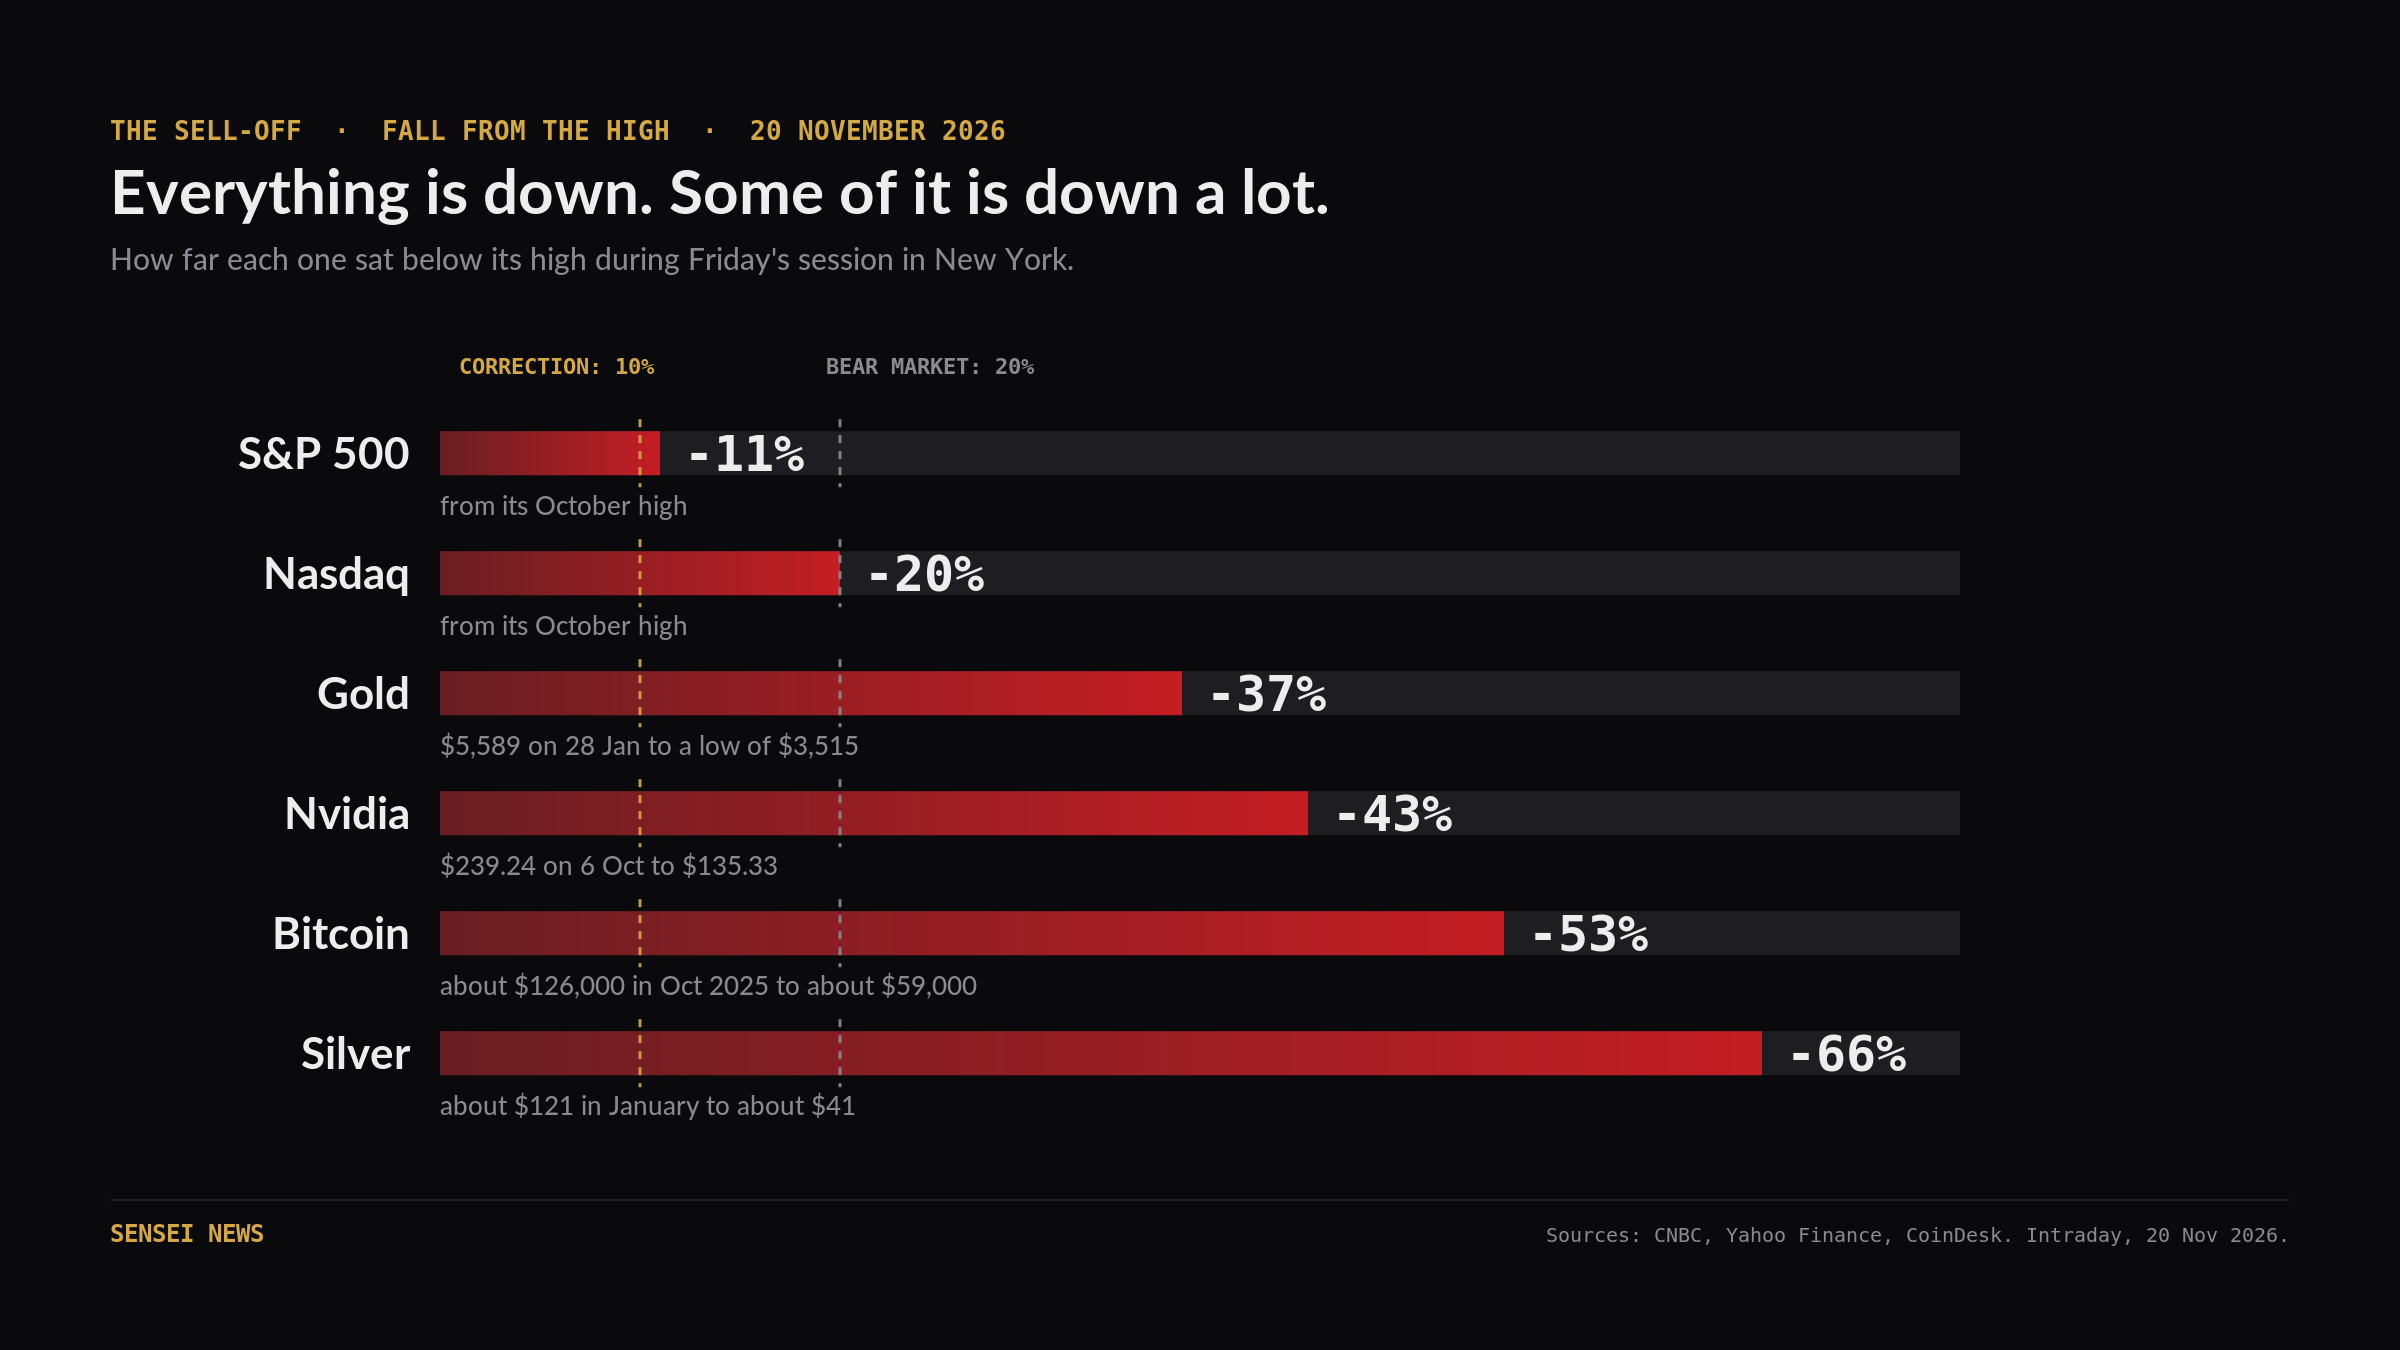
So is this a crash? Wall Street has 2 lines for it. A correction is a fall of 10% from the high, and a bear market starts at 20%. The S&P 500 is through the first line. The Nasdaq hit the second today.
How much has been wiped off
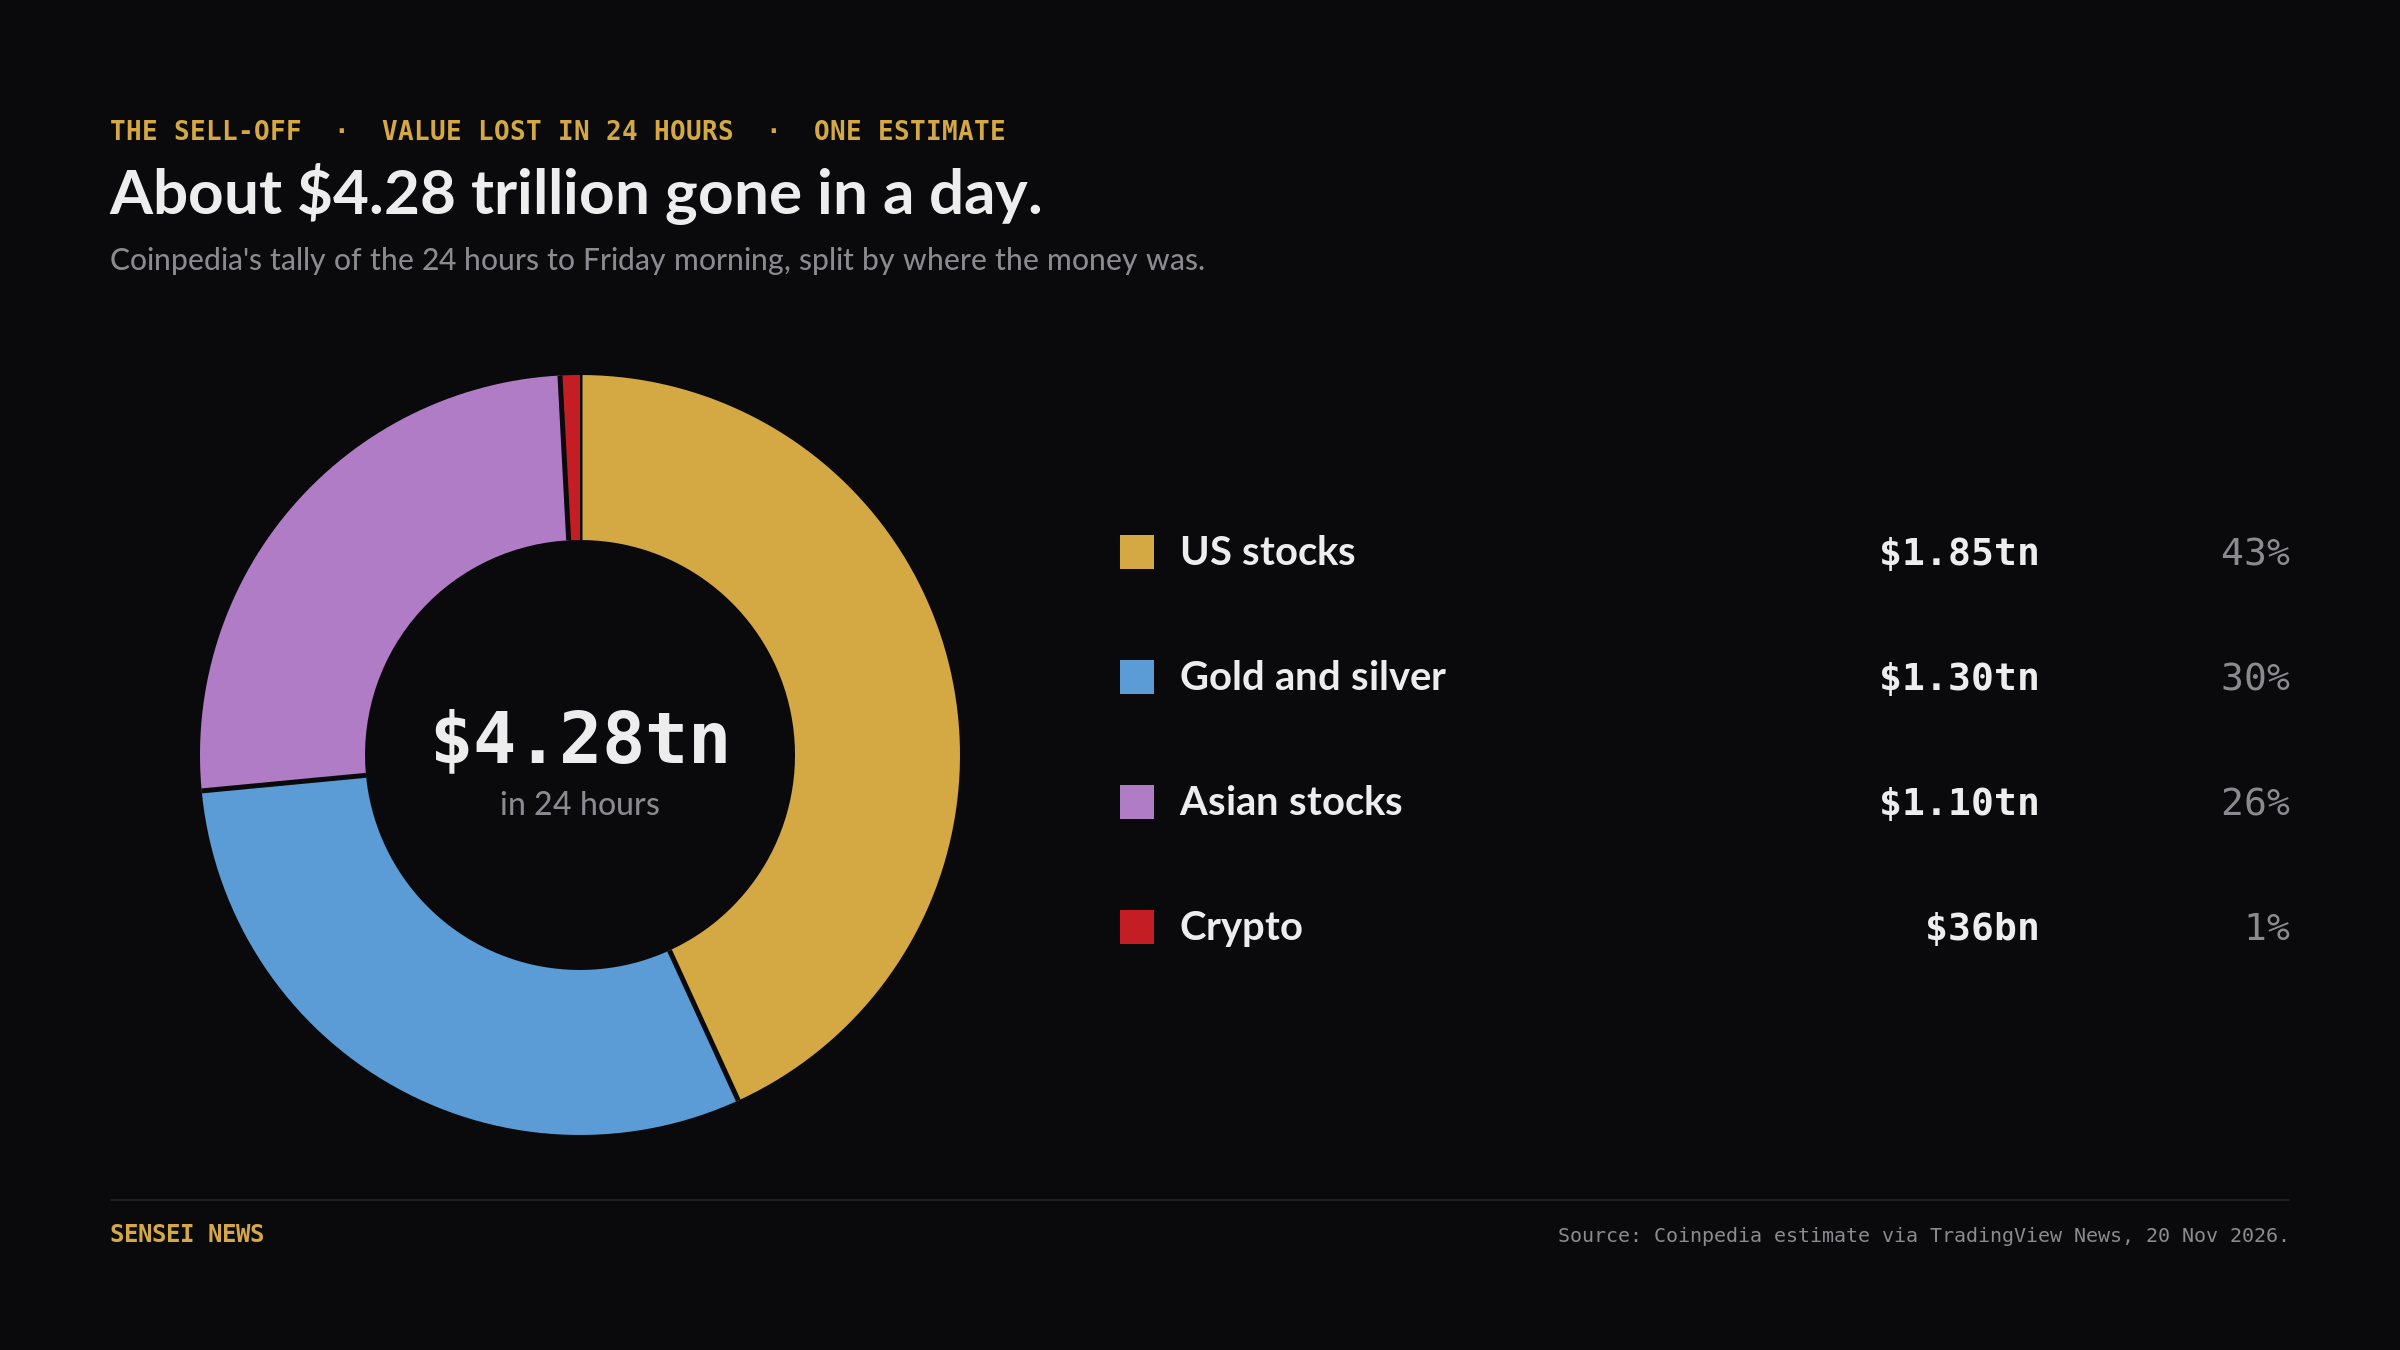
Coinpedia counted nearly $4.28 trillion of value lost across markets in the 24 hours to Friday morning. US stocks made up about $1.85 trillion of it and Asian stocks about $1.1 trillion. Gold and silver lost about $1.3 trillion between them, and crypto about $36 billion. That is one outlet’s estimate, and Friday’s selling in New York came on top of it.
Why everything is falling together
There are 3 reasons, and they feed each other.
The Fed is raising rates. US rates sit at 3.75% to 4.00%, and the next decision is on 9 December. Readings from CME’s FedWatch tool have put the chance of a rise between 90% and 100% this week. JPMorgan’s Michael Feroli forecasts 3 rises in a row, in December, January and March. Why does that hit gold and bitcoin? Neither pays any interest. When cash and bonds pay more, owning something that pays nothing costs more by comparison.
The AI trade is unwinding. AI stocks drove most of this year’s gains, and now they are driving the losses. AMD fell 9.4% today and Broadcom 9.2%. Micron lost 12.8% and SanDisk 14.7% after TrendForce turned bearish on flash-memory prices for 2027. Anthropic raised a record $81.34 billion in its IPO and started trading on Thursday. Its shares fell about 12.8% on their second day. The selling has spread well beyond AI. On Thursday, 464 stocks in the S&P 500 fell and 37 rose. That is more than 90% of the index down, and all 11 sectors finished lower.
Investors are raising cash. When losses pile up in one place, funds sell whatever they can elsewhere, and that includes the safe assets. Gold fell today even as bond yields dropped, which is the reverse of the usual pattern. The money went into US government bonds, and the 10-year Treasury yield fell more than 10 basis points to 4.95%. Baird’s Ted Mortonson described the day to Bloomberg as “total de-risking going on.”
Nvidia: about $2.5 trillion gone
$239.24. That was Nvidia’s record close on 6 October. Today it traded at $129, which is 46% lower. On 24.1 billion shares, that is about $2.7 trillion of market value gone in under 7 weeks. This is also its seventh weekly fall in a row.
What happened? Jensen Huang, the co-founder who ran the company for more than 30 years, resigned on 12 November. His exit followed reports of extramarital affairs, including one with a woman suspected of working with Chinese intelligence. Washington has also moved to close a loophole that let Chinese firms rent Nvidia’s chips overseas.
Is the business broken? Tuesday’s results say otherwise. Revenue was $115.8 billion, up 103% on a year earlier, and the company guided to about $130 billion for the current quarter. The shares fell anyway. Board chair Harvey Jones told investors the board “does not intend to reinstate Jensen as CEO.” The sales are there. The doubt is over who runs Nvidia and what Washington does next.
Has this happened before?
Yes. It happened in 2008 and again in 2020, and both times gold fell with everything else.
In 2008, gold dropped about 32%, from $1,023.50 in March to about $692 in October, as funds sold it to cover losses. It then rose 163% to $1,917.90 by August 2011. In March 2020 it fell to about $1,472 in the first weeks of the pandemic. Less than 5 months later it hit a record $2,067.15.
Both times, gold found its low before stocks did. Gold bottomed in October 2008 and the S&P 500 in March 2009. In 2020, gold’s low came on 17 March and the S&P 500’s on 23 March.
There is one big difference this time. In 2008 and 2020 the Fed was cutting rates. Today it is raising them. That is why I can’t tell you the low is in.
And stocks? CFRA looked at every correction since 1946 that stopped short of a bear market. On average they took 133 days to hit bottom and lost nearly 14%. Of the 27 corrections between 1974 and early 2025, 6 turned into bear markets. So most corrections stay corrections, and more than 1 in 5 gets worse.
Where my head is at
It’s going to be a difficult day for many people. But this is part of investing.
There can be more pain ahead. In this morning’s Morning Forecast, the first target on my S&P 500 chart was around 7,000. We got there this afternoon. I’d at least expect a relief rally around here. The next target on my chart is 6,517.9.
Here is what I’m watching most. Until gold and silver bottom, I don’t see bitcoin bottoming or the markets bottoming. We’ve seen how gold and silver performed over the years. Yes, they went up fast, and they can go lower from here. One final capitulation is possible. But I think we are close to a bottom on precious metals. That’s my read.
You need to keep a level mind on days like this.
Below, for premium members: every trade I made today, where I bought bitcoin, why I held back on XRP, my zones for gold and silver, and where my high-risk portfolio stands tonight.
If you can read past this line, you’re a premium member. If you can’t, the full edition is open to premium members only.