
Morning Forecast: Wednesday, 31 December
Copper’s tariff-driven rally, silver overtaking oil, China’s uneven growth, a weakening dollar, Wall Street’s M&A surge, and why overlooked stocks may offer better 2026 upside.

⏰ Last Call: $2,000 XRP Giveaway Ends Tonight
Today is the final day to enter our $2,000 XRP Giveaway — entries close December 31st at 3:00 PM CDT.
🥇 1st Prize: $2,000 in XRP
🥈🥉 2nd & 3rd Prizes: Exclusive merchandise
🎥 Draw: LIVE on YouTube (Martyn Lucas Investor) - ‼️Must be present to win‼️
🎟️ Entry: Free and fun - more entries improve odds, but one ticket can win
🆕 Bonus: New ways to enter added daily
T&Cs on the website.
Don’t miss it. This is your last chance. 🚨
This content is for informational and educational purposes only and does not constitute financial advice. Always do your own research. Not financial advice (NFA).
👀 Today’s Stories at a Glance
🏗️ Copper’s Record Year: Copper hit records on tariff front-loading and supply disruptions, masking weak demand and gold-favoring growth skepticism.
🥈 Silver Flips Oil: Silver surged past oil on tech demand and export curbs, while crude slumped amid surplus fears.
🇨🇳 Xi’s 2025 Victory: China met growth targets via tech exports as property, consumption, and investment engines stalled.
📉 Dollar’s Faceplant: The dollar logged its worst year since 2017 as rate cuts, tariffs, and narrowing yield gaps hit demand.
🤝 M&A Supercycle Ahead: Cheaper money and lighter regulation fueled mega deals, signaling consolidation opportunities, and concentration risks, into 2026.
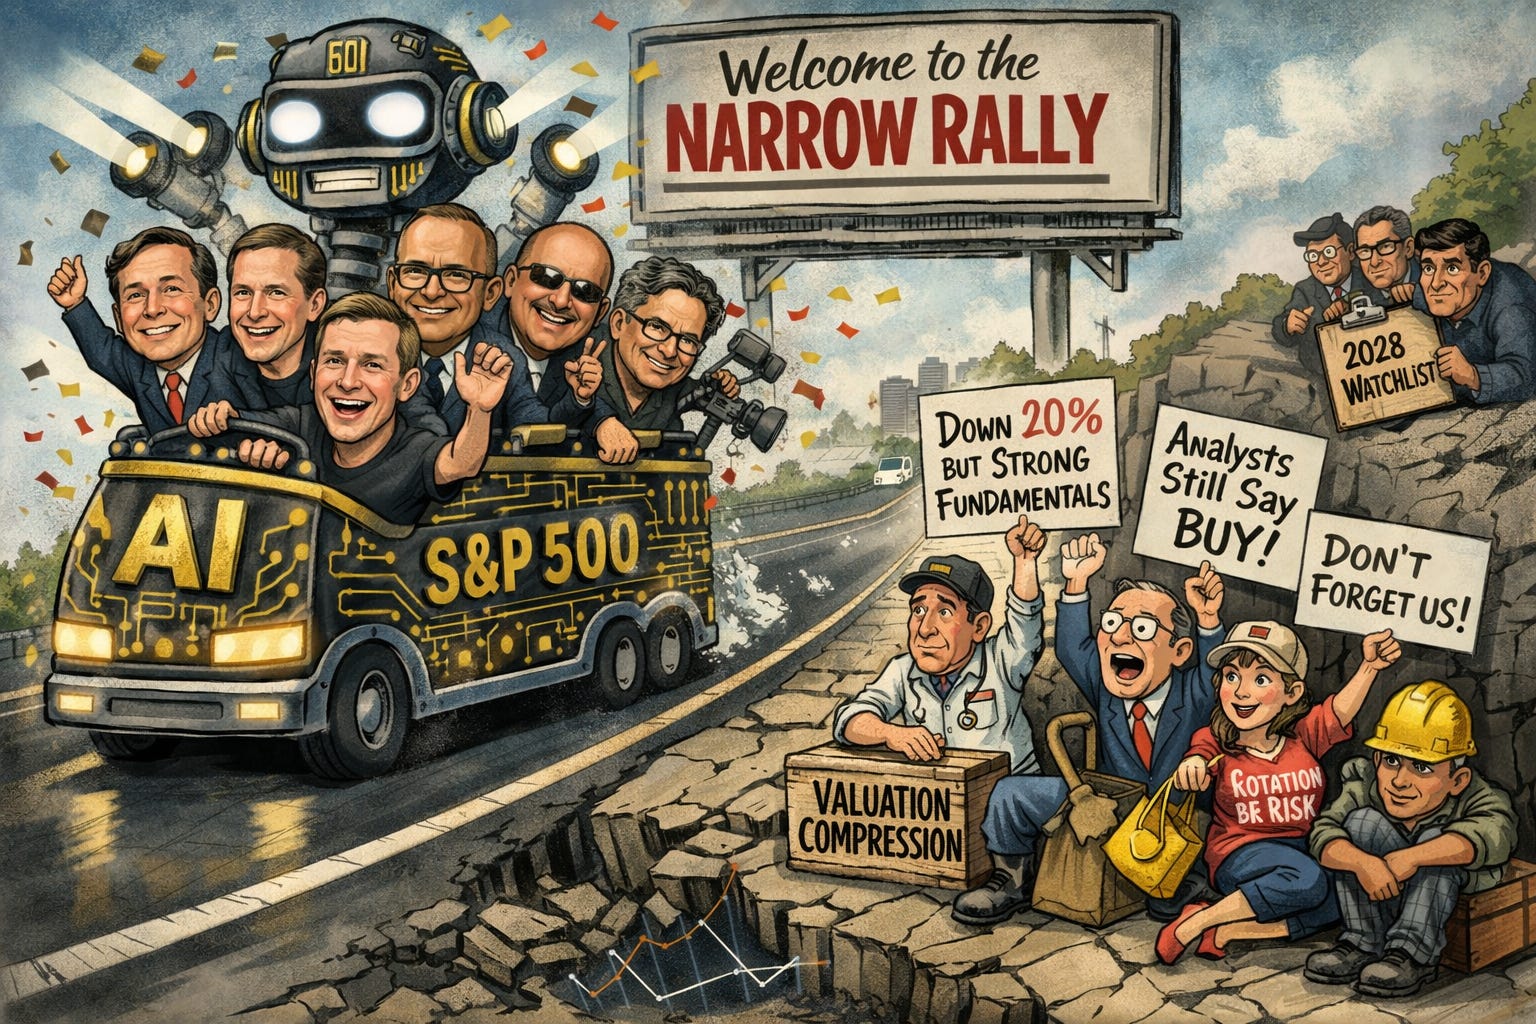
🔍 Deep Dive: Extreme S&P 500 concentration left many quality stocks mispriced, creating rotation-driven upside opportunities heading into 2026.
🧠 One Big Thing
The $100 XRP Delusion
The widely circulated forecast that XRP would reach $100 by the close of 2025 has officially transitioned from speculative theory to mathematical absurdity. For this price to manifest from current levels near $2.00, the token would need to gain over 5,000 percent in a single day. Advocates leveraged theories about institutional accumulation and fund inflows to sustain this narrative despite clear evidence to the contrary. These claims ignored the basic laws of liquidity and the reality of market capitalization. For investors, this serves as a critical lesson in the danger of following extreme price targets built on absolute certainty. This outcome serves as a necessary warning that loud conviction cannot override the fundamental mechanics of the market.
⚖️ Fear & Greed
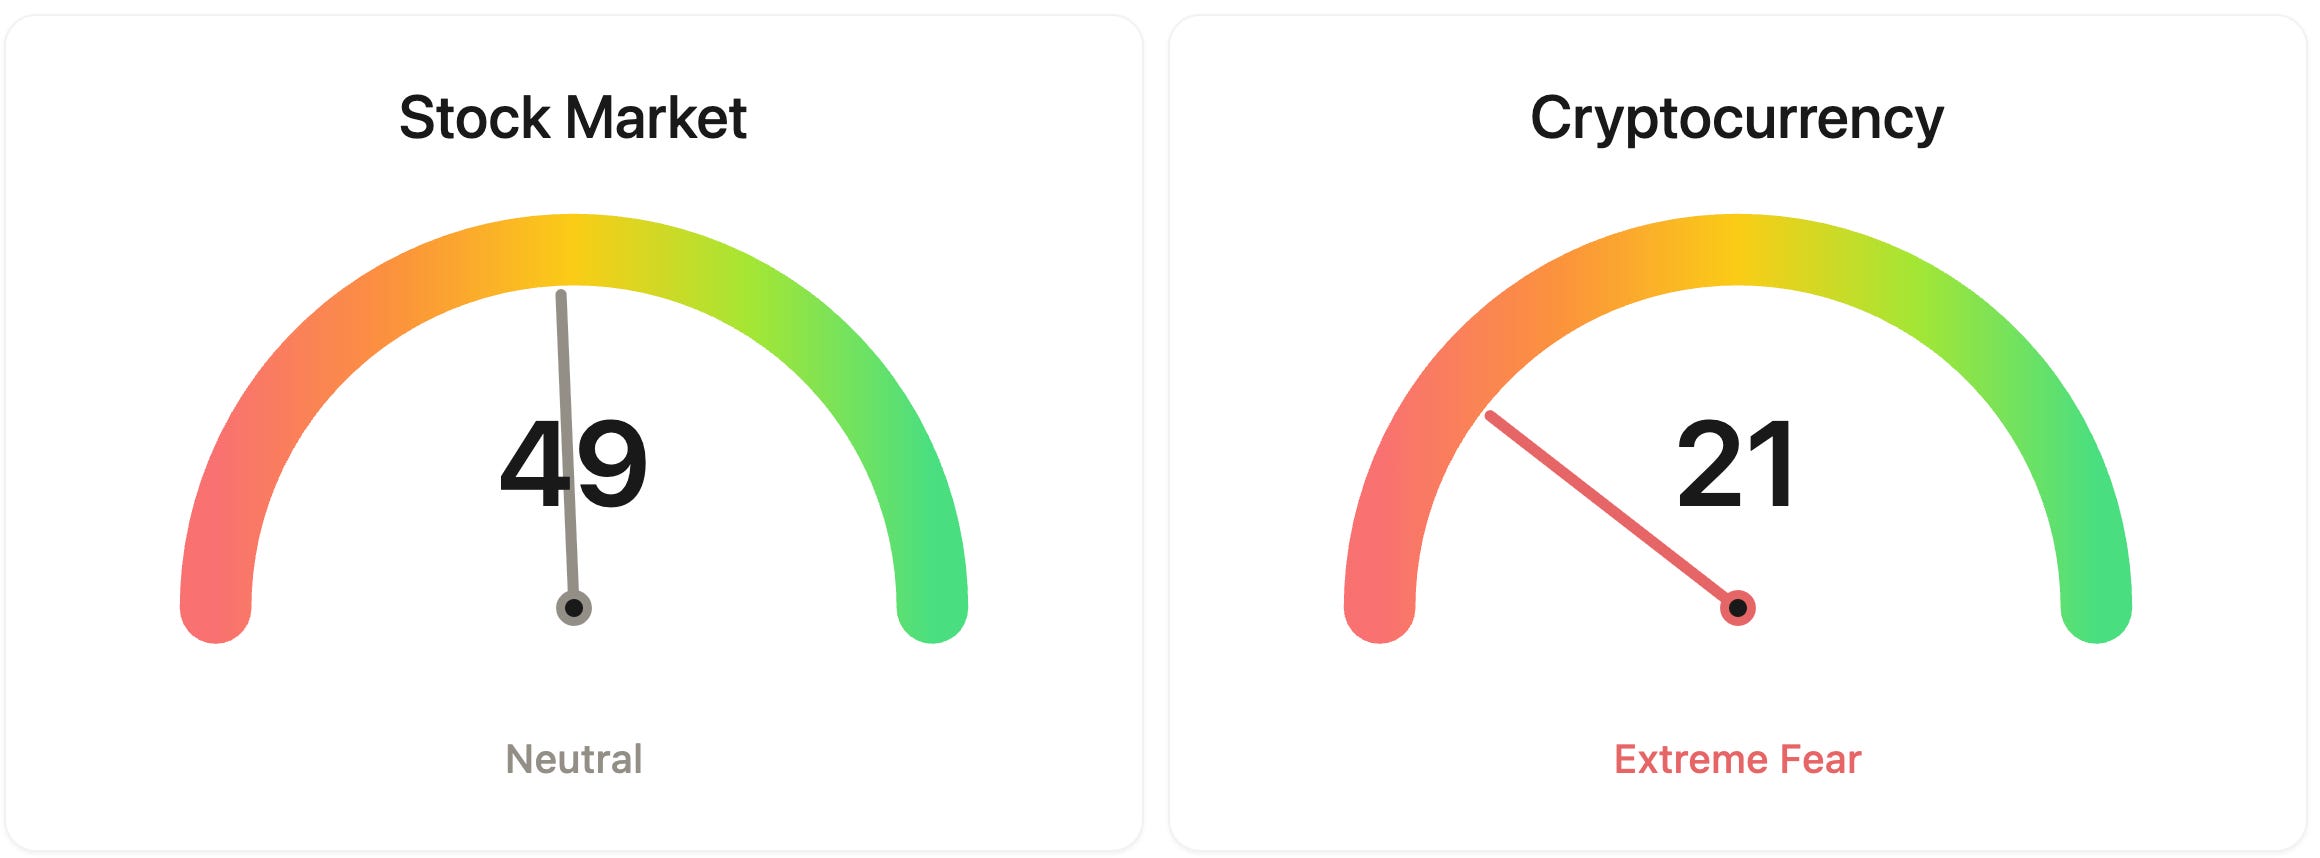
📉 The Number That Matters
5,200%
XRP requires a 5,200% surge to hit a $100 target by tonight. Such impossible predictions create dangerous financial traps for retail investors. Disregarding these fabricated targets is essential for capital preservation in a highly speculative and volatile market.
⚔️ Winners vs Losers
Winners
GHC +8.65%: Graham Holdings Company shares rose following a Q3 earnings beat and increased institutional accumulation from firms including Norges Bank.
AFJK +89.19%: Aimei Health Technology Co., Ltd surged amid high volatility after shareholders approved a thirteenth extension for its merger with United Hydrogen Group.
Losers
JCAP -7.22%: Jefferson Capital, Inc. shares pulled back as the stock entered a consolidation phase after the December post-IPO lock-up expiration.
HIVE -5.17%: HIVE Digital Technologies Ltd declined in sympathy with the Bitcoin mining sector as falling hashprices and difficulty adjustments compressed miner profit margins.
AHMA -21.49%: Ambitions Enterprise Management shares dropped as investors engaged in profit-taking following a significant December surge fueled by strong semi-annual earnings.
VNDA -2.36%: Vanda Pharmaceuticals Inc. shares edged lower as the market had already priced in the recent FDA approval for its motion sickness treatment.
📊 Market Snapshot
Cryptocurrencies:
Bitcoin (BTC): $88,898 (▲ 0.57%)
Ethereum (ETH): $2,996 (▲ 0.86%)
XRP: $1.88 (▲ 0.10%)
Equity Indices (Futures):
S&P 500: $6,884 (▼ 0.21%)
NASDAQ 100: $25,598 (▼ 0.30%)
FTSE 100: £9,918 (▼ 0.30%)
Commodities & Bonds:
10-Year US Treasury Yield: 4.11% (▼ 0.34%)
Oil (WTI): $58 (▲ 0.60%)
Gold: $4,308 (▼ 0.70%)
Silver: $72.03 (▼ 5.50%)
Data as of UK (GMT): 11:43 / US (EST): 06:43 / Asia (Tokyo): 20:43
✅ 5 Things to Know Today
🏗️ Copper’s Record Year: A Strategic Disconnect
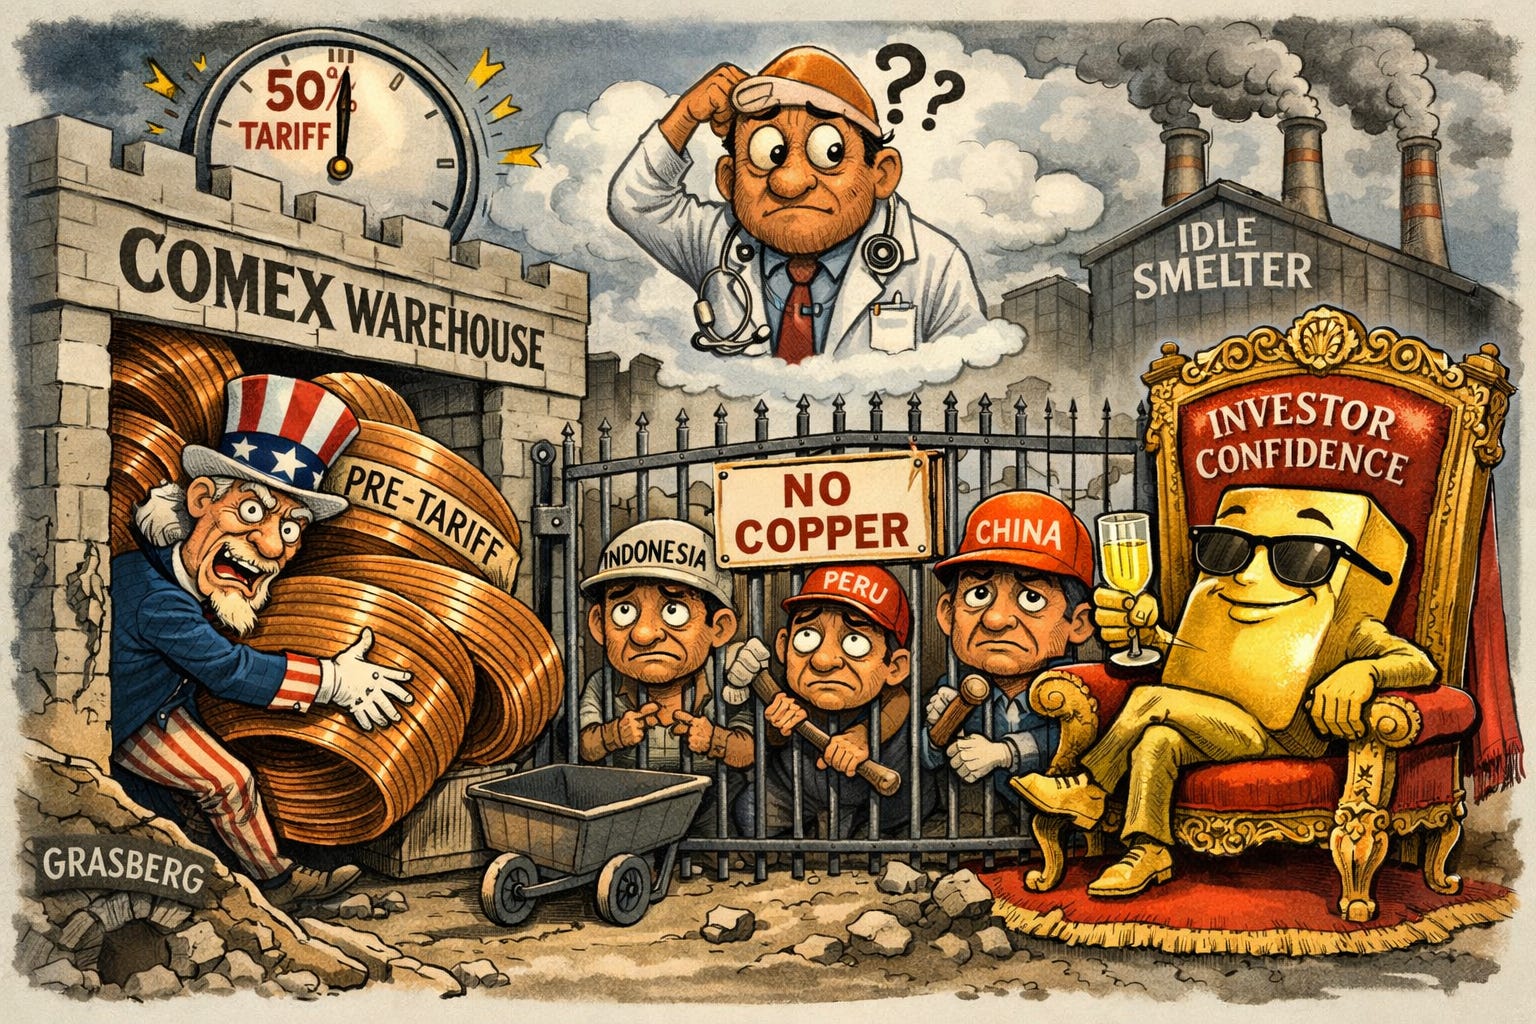
Copper prices have surged to an all-time high of $12,960 per metric ton on the London Metal Exchange (LME), marking a 40%+ gain for 2025. It’s the metal’s strongest annual performance since 2009, but the rally is built on a strange foundation. While prices are at records, the primary driver isn’t immediate industrial use; it’s a massive “front-loading” effort by US importers racing to beat a 50% tariff on semi-finished copper that took effect in August. This has pulled nearly 400,000 tons of copper into US Comex warehouses, effectively locking up half the world’s exchange stockpiles and starving the global market. In fact, refined copper imports into the US more than doubled in the first eight months of the year, hitting 1.19 million tons (Bloomberg).
For retail investors, the real story is the “hidden” supply crisis. Beyond the tariff games, Chinese smelters, which process half the world’s copper, are running at just 76% capacity because refining fees (TC/RC) have crashed to 10-year lows, making production unprofitable. Meanwhile, a catastrophic mudslide at the Grasberg mine in Indonesia and labor unrest in Peru have tightened the taps on raw ore. The result is a bizarre market: copper prices are at record highs, yet the copper-to-gold ratio has plunged to 0.00078, the lowest in 175 years. This historic low suggests that while “Dr. Copper” is expensive, smart money is still fleeing to gold, signaling deep skepticism about long-term global growth.
Sensei’s Insight: Watch the US inventory levels. If those stockpiles start hitting the market or if tariffs are delayed, the “artificial” scarcity could vanish, potentially sending prices back toward the $10,000 mark in 2026.
🥈 Silver Flips Oil in a Rare 45-Year Inversion
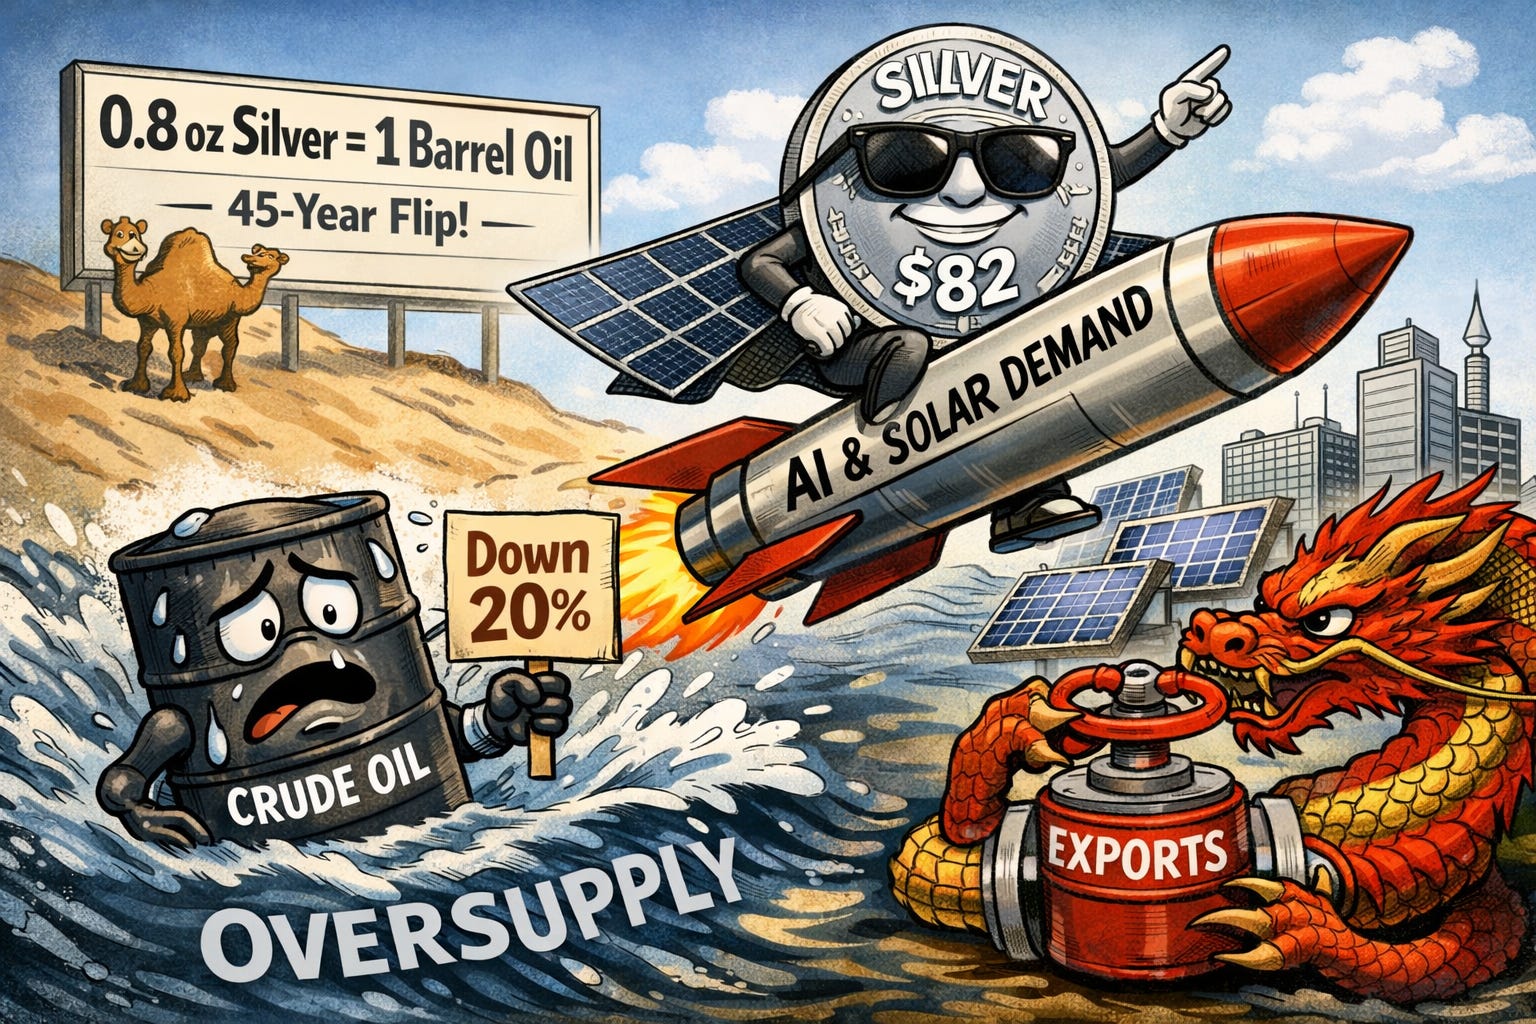
Oil is closing out its roughest year since the 2020 pandemic. WTI dropped 20% to $58.03 and Brent fell 18% to $61.40 as OPEC+ pivoted to defending market share over high prices. On the other side of the floor, silver has gone on a tear, surging 185% to a record $82.33. This has triggered a historic inversion: for the first time in 45 years, one ounce of silver costs more than a barrel of crude. The usual ratio of 3.8 ounces per barrel has collapsed to roughly 0.8 to 1, signaling a massive valuation gap between these two commodities (Investing.com).
This divergence highlights two opposite extremes. Oil is drowning in a surplus that could hit 3.85 million barrels per day in 2026, especially if China slows its massive stockpiling campaign. Silver, however, is being squeezed by structural industrial demand from solar panels and AI data centers, paired with new Chinese export restrictions starting tomorrow. Retail investors should keep an eye on the 1980 Hunt brothers precedent. While the current demand is tied to real tech needs, the speed of this move suggests a speculative bubble. If historical norms return, either oil needs a shock upward or silver faces a heavy correction.
Sensei’s Insight: Watch the $50 WTI support and silver’s response to China’s new export limits. This inversion suggests the market is pricing a high-tech future while the old-energy reality remains oversupplied.
🇨🇳 Xi Declares 2025 Victory, But China’s Growth Engine Shows Strain
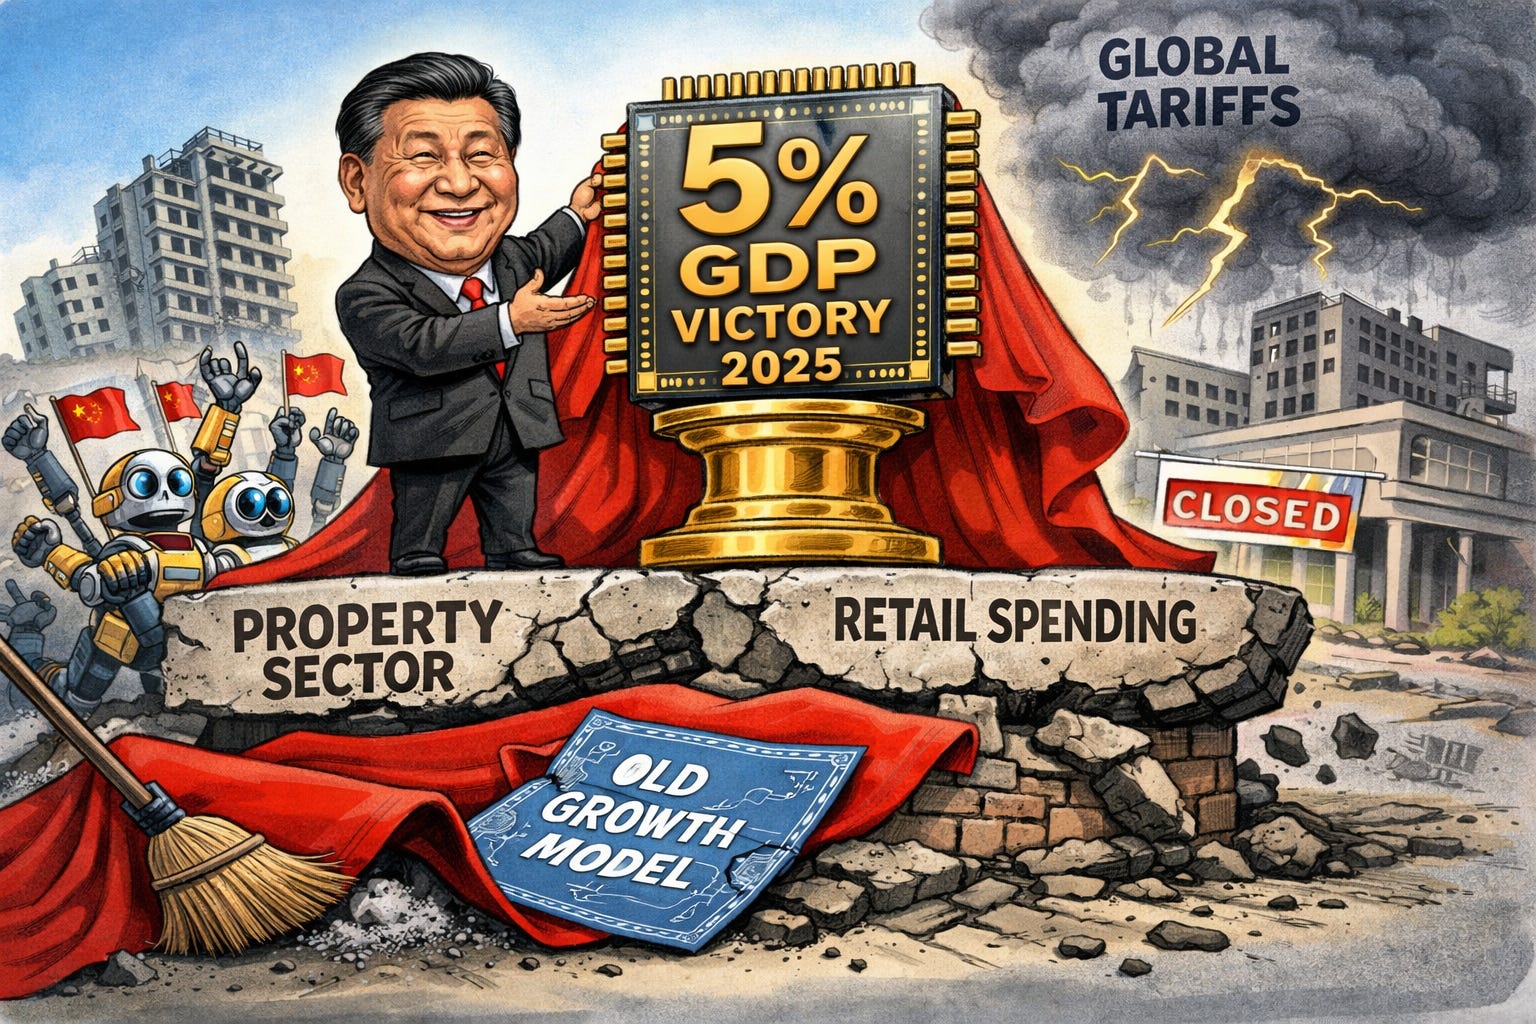
President Xi Jinping closed out the year on Wednesday by declaring that China’s economy is set to hit its full-year growth target of approximately 5%. This matches the 2024 growth rate, but the path to get there was far from smooth. Xi characterized 2025 as an “extraordinary year” where the economy forged ahead under pressure, shifting toward innovation rather than raw expansion. While the headline number looks steady, the internals are a tale of two economies. Manufacturing activity finally crawled back into expansion territory in December with a PMI of 50.1, its first positive reading since March, but this was offset by a brutal 15.9% collapse in property investment and retail sales growth that bottomed out at 1.3% in November, the slowest pace since the pandemic (Bloomberg).
This data suggests China is hitting its targets through a massive pivot to high-tech exports while its domestic engine stalls. High-tech manufacturing surged 9.2%, and industrial robot production jumped nearly 30%, signaling that Beijing is successfully moving up the value chain to bypass trade hurdles. However, for retail investors, the red flag is the 2.6% decline in fixed-asset investment. It’s the first annual contraction since 1998, proving that the old “build it and they will come” growth model is officially broken. Without a recovery in consumer spending or property stability, the 5% growth achieved this year may be difficult to replicate in 2026 without aggressive state intervention.
Sensei’s Insight: Watch the 50-point PMI line and semiconductor output. China is trading property stability for tech dominance, but if exports face new global tariffs, this “high-quality” growth strategy could quickly lose its luster.
📉 The Dollar’s 2025 Faceplant
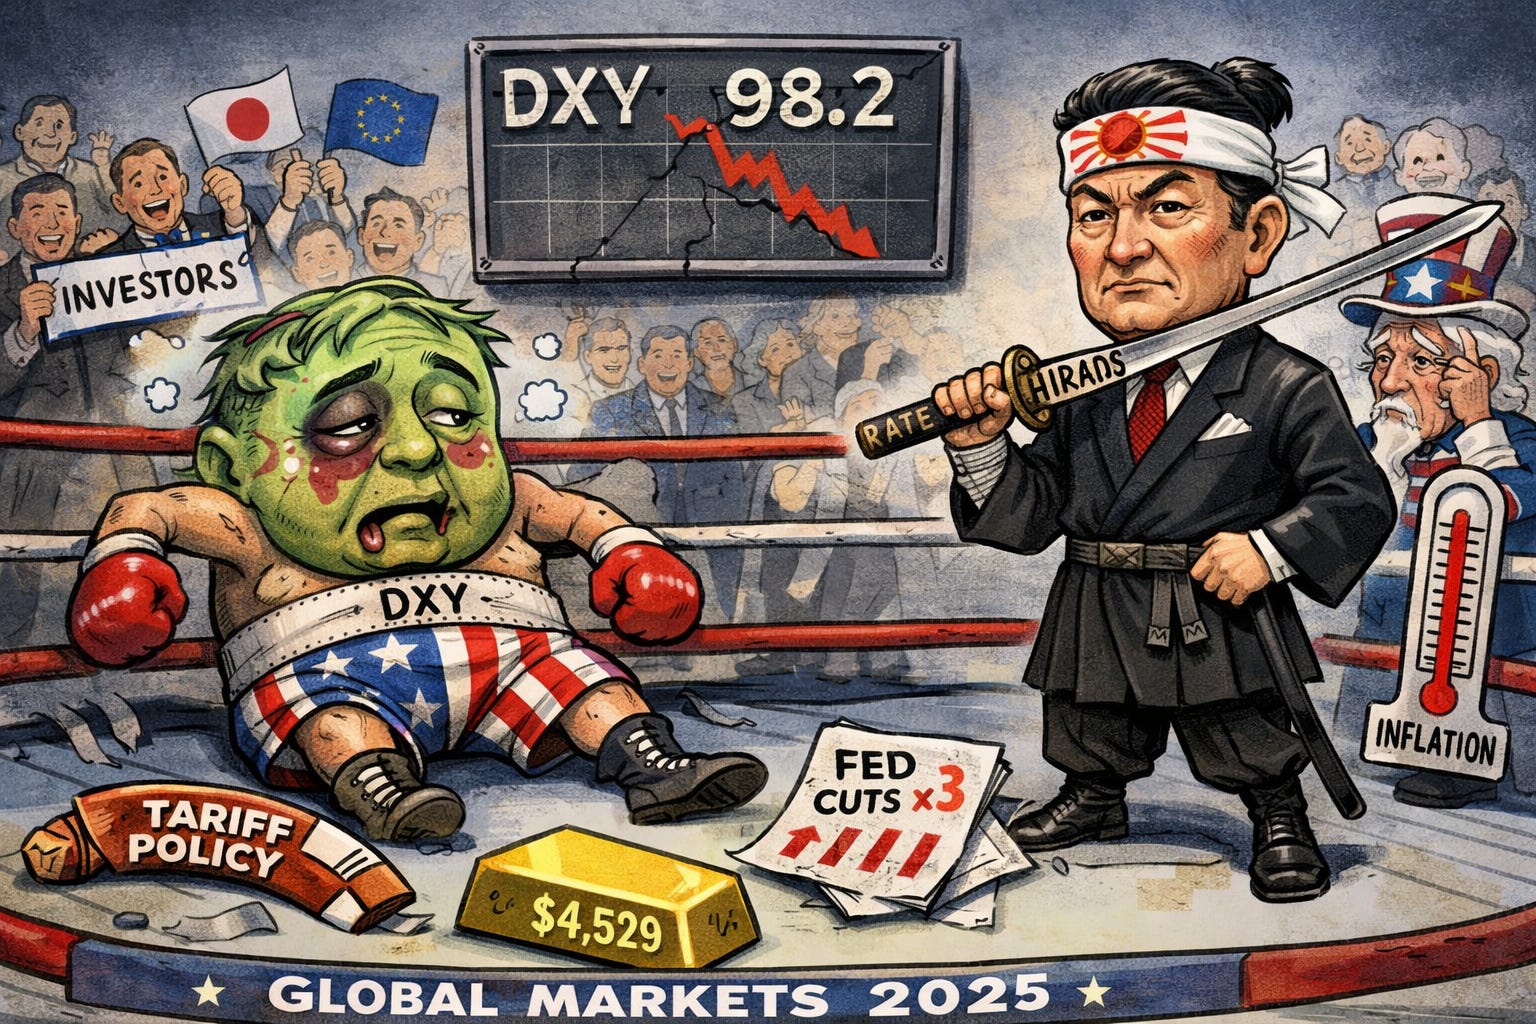
The U.S. Dollar Index (DXY) is ending 2025 with a 9.6% annual slide, its worst performance since 2017. It’s a massive reversal from the January peak of 110, when optimism for the new administration’s policies was at its height. The real pain started in April after the “Liberation Day” tariff announcement triggered a sudden 2% single-day drop, signaling that policy uncertainty was outweighing protectionist support. Since then, a cooling labor market pressured the Fed into three interest rate cuts, bringing the fed funds rate down to a range of 3.50% to 3.75%. By year-end, the DXY settled at 98.2, suggesting the long-standing dollar bull run has stalled (Barron’s).
This shift represents a global reshuffle of capital. While the Fed is easing, other central banks like the Bank of Japan are hiking rates to 30-year highs. This narrows the “yield differential,” making U.S. assets less attractive compared to foreign alternatives. For investors, the impact is clear: international stocks outperformed the S&P 500 by 11 percentage points this year, the largest gap since 1993. Commodities are also surging, with gold hitting a record $4,529 as central banks diversify away from the greenback. However, watch for sticky inflation in 2026, as a weaker dollar and new tariffs make imported goods significantly more expensive for U.S. households.
Sensei’s Insight: Watch the 98.2 support level on the DXY. If the upcoming January appointment for the Fed Chair signals even more aggressive easing, the dollar could see another 5% slide in 2026.
🤝 Wall Street Braces for a 2026 M&A Supercycle
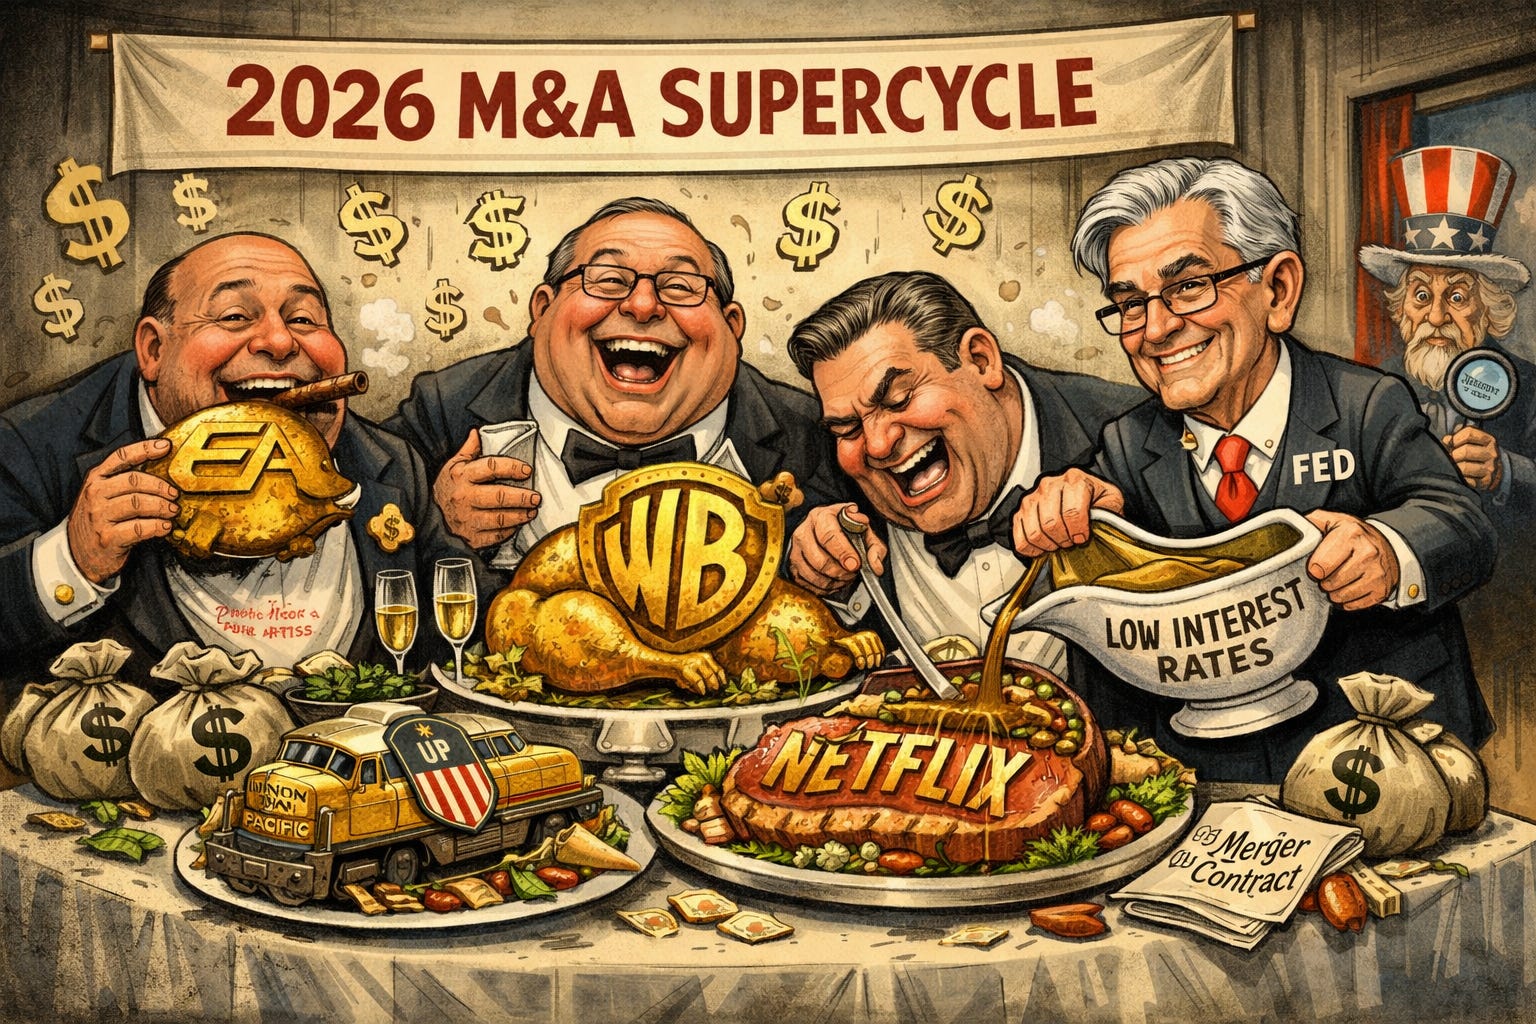
Wall Street is preparing for a massive wave of consolidation. Global M&A hit $4.5 trillion in 2025, a 50% jump from the previous year. We saw a record 68 megadeals valued at over $10 billion, including Electronic Arts’ $55 billion leveraged buyout and Netflix’s $72 billion bid for Warner Bros. Discovery. This volume is being fueled by a 75-basis-point drop in interest rates and a shift toward more lenient regulatory enforcement. Average deal sizes hit $227 million, a historical high showing that CEOs are increasingly comfortable placing massive bets on industry dominance (Wall Street Journal).
This activity signals a fundamental reshuffling of market leaders across major sectors. For retail investors, the trend suggests a potential take-private premium for companies perceived as undervalued, as seen with the PIF-led buyout of EA. However, it also brings concentration risk. A combined Union Pacific and Norfolk Southern would control 40% of U.S. rail freight, which may invite political pushback despite a business-friendly White House. Watch for more spinoffs in 2026 as conglomerates like WBD shed traditional cable assets to make themselves more digestible for streaming-focused buyers.
Sensei’s Insight: The supercycle suggests a target-rich environment, but beware of deal-fever premiums. Watch the Surface Transportation Board’s rail ruling: it will be the litmus test for 2026’s regulatory limits.
🔗 Connect with Us
Stay plugged in across platforms:
Sensei on X: sensei_live_
Martyn Lucas on X: MartynInvestor
Vaz on X: eVTOLHUB
📺 YouTube Channel (Live & Replays): Martyn Lucas Investor

🔍Deep Dive: Why Analysts See Big 2026 Upside Elsewhere
Keep reading with a 7-day free trial
Subscribe to Sensei.news to keep reading this post and get 7 days of free access to the full post archives.