
Sensei’s Morning Forecast: No Data, No Direction - Powell’s Gamble Amid Silver Panic & Job Losses
Powell’s speech looms amid a data blackout, UK job fears, silver market chaos, rising tariffs, volatile earnings, and Metaplanet’s crypto warning—markets brace for serious crosscurrents.


👀 Today’s Stories at a Glance
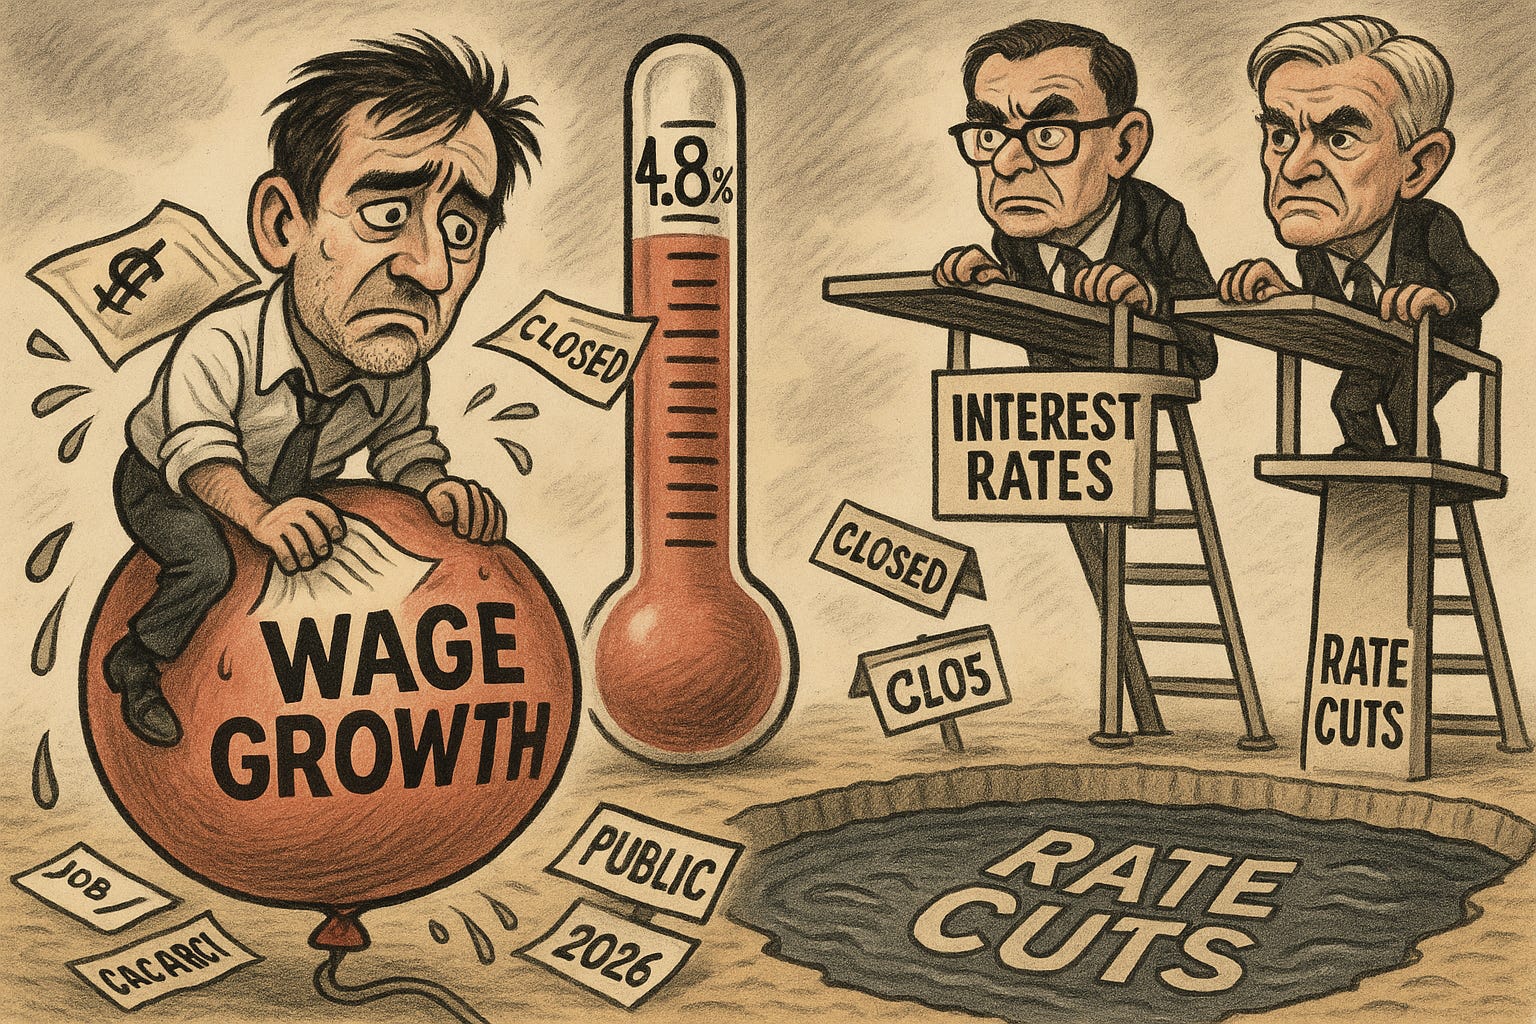
📉 UK Jobless Rate Rises: Unemployment hits 4.8%, wage growth slows — signalling softening labour markets and rate cut potential.
🪙 Silver Squeeze in London: Record silver prices surge past $52 as vault shortages trigger panic buying and market dislocation.
⚔️ China–U.S. Trade War Escalates: New tariffs and shipping sanctions push tensions beyond goods into maritime and logistics infrastructure warfare.
💼 Earnings Season Reality Check: High valuations face scrutiny as investors demand proof of earnings beyond tech-fueled optimism.
₿ Metaplanet Trades Below BTC Value: Market doubts crypto-equity model as Japan’s ‘MicroStrategy’ dips beneath its net Bitcoin holdings.
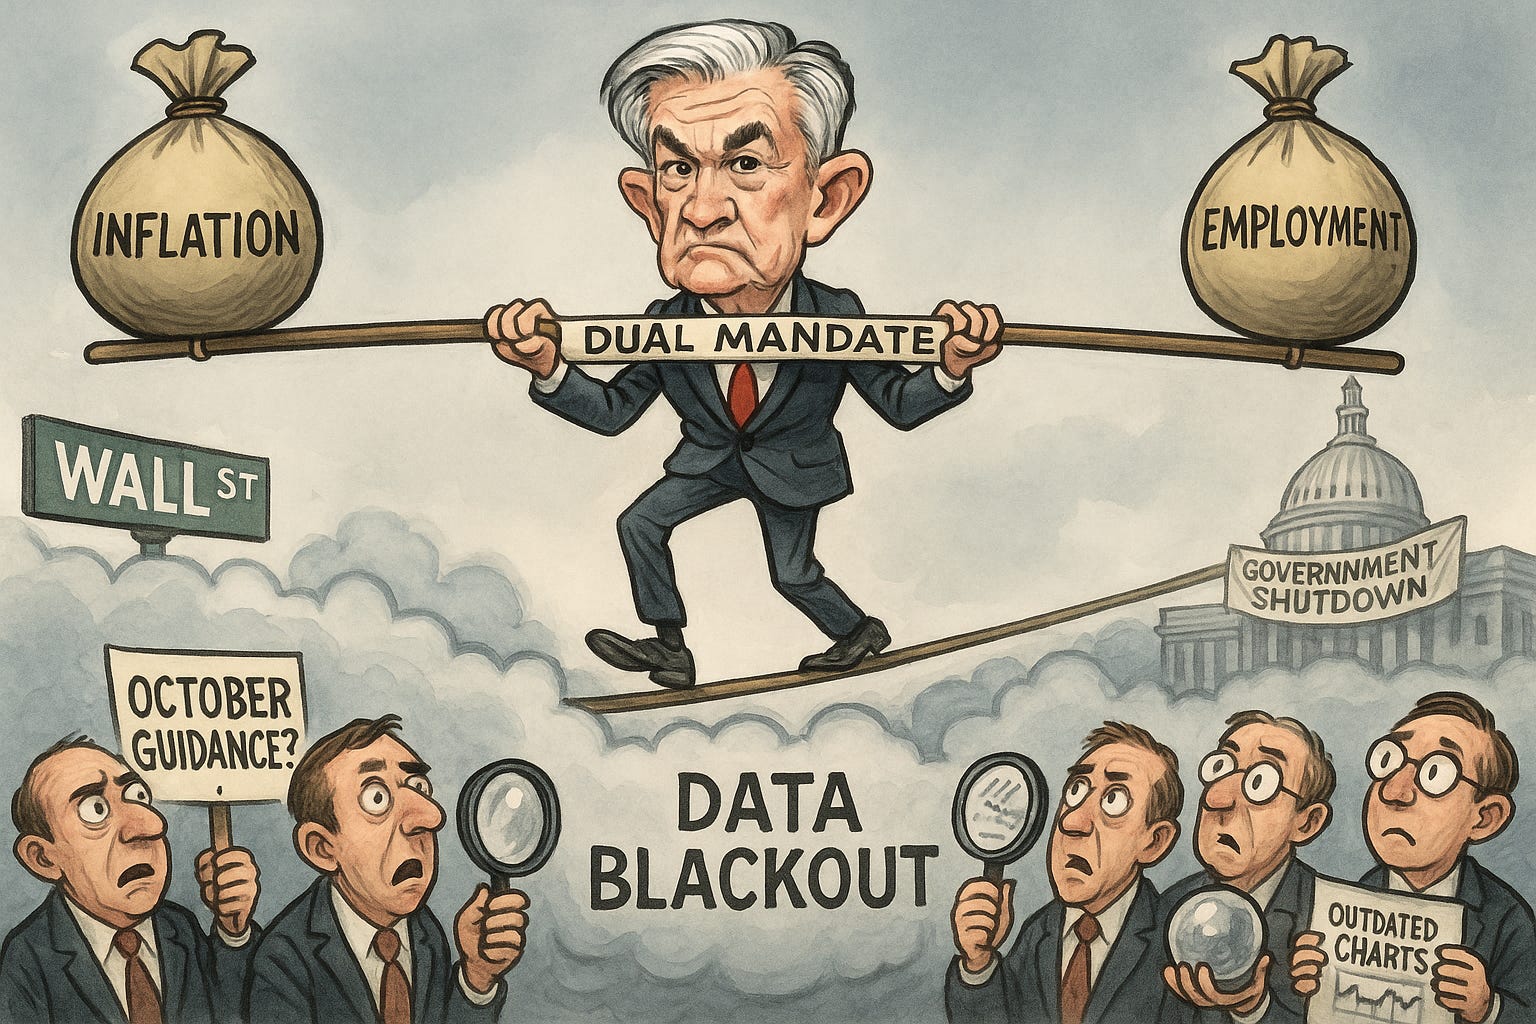
🗣 Powell’s Speech in a Data Void: With key data silenced, markets hang on Powell’s words to gauge Fed’s next policy steps.
🧠 One Big Thing
UK unemployment hit 4.8%, a 3-year high, while wage growth cooled to 4.4% — both signs that Britain’s labor market is softening fast. With job vacancies falling for the 22nd straight month, pressure is mounting on the Bank of England to consider rate cuts sooner.
💰 Money Move of the Day
Slowing wage growth and rising unemployment often signal rate cuts ahead. Traders watch long-duration bond ETFs like $TLT or $IEF for early moves when policy pivots feel near — not as a trade, but as a rate-sentiment gauge.
📊 Market Snapshot
Cryptocurrencies:
Bitcoin (BTC): $110,314.20 (▼ -4.31%)
Ethereum (ETH): $3,896.39 (▼ -8.22%)
XRP: $2.4176 (▼ -7.29%)
Equity Indices (Futures):
S&P 500 (SPX): 6,575.90 (▼ -1.08%)
NASDAQ 100: 24,604.00 (▼ -1.28%)
FTSE 100: 9,406.68 (▼ -0.52%)
Commodities & Bonds:
10-Year US Treasury Yield: 4.005% (▼ -1.33%)
Oil (WTI): $58.18 (▼ -2.47%)
Gold: $4,141.93 (▲ +0.77%)
🕒 Data as of UK (BST): 11:32 / US (EST): 06:32 / Asia (Tokyo): 19:32
✅ 5 Things to Know Today
📉 UK Jobless Rate Hits 3-Year High as Wage Growth Cools
UK unemployment climbed to 4.8% in the three months through August — the highest since May 2021 — underscoring a gradual but clear softening in Britain’s labour market, according to the Office for National Statistics. Private-sector wage growth eased to 4.4% from 5.1% in the prior period, its slowest pace in nearly two years, suggesting pay pressures that once drove inflation are now losing steam as hiring demand cools. The ONS also noted that vacancies have fallen for the 22nd consecutive month, while redundancies edged higher, consistent with an economy still adjusting to restrictive monetary policy and sluggish output growth (Reuters).
September payroll data showed a 10,000 drop in employment, though historical revisions indicate total job losses of just 127,000 since October 2023 — a smaller hit than initially estimated. The economic inactivity rate held steady at 21%, the lowest since before the pandemic, as more people returned to work and firms took advantage of a larger available labour pool. Combined with cooling wages, this signals a potential turning point in the UK’s post-inflation recovery narrative. Analysts note similar dynamics are unfolding in the United States, where recent data also showed slowing job creation and moderating pay growth, suggesting both economies could be on a synchronized path toward softer labor markets and eventual monetary easing (Bloomberg).
Sensei’s Insight: Rising unemployment and decelerating wage growth strengthen the case for a Bank of England rate cut, potentially aligning with the Federal Reserve’s own easing cycle if global disinflation continues. Investors should watch upcoming CPI prints and BoE commentary for signs of a policy shift — a synchronized slowdown across major economies could reshape yield expectations and rekindle appetite for rate-sensitive assets like growth stocks and real estate.
⚡️ Silver Squeeze Deepens as London Market Seizes Up

Silver prices have rocketed past $52 an ounce, hitting a new record as a violent short squeeze grips the London Bullion Market Association (LBMA). Physical inventories in London vaults have collapsed to their lowest levels in over a decade, forcing traders to scramble for metal to settle contracts. According to the Financial Times, some dealers have been flying silver bars in from the U.S. and Switzerland to meet delivery obligations, as local supply runs dry and vault operators warn of delayed settlements. The stress has pushed lease rates—the cost to borrow silver—to over 30% annualized, the highest since data began, leaving short sellers in a losing battle to roll or cover positions. The imbalance has widened the London–New York price spread to more than $2/oz, an inversion that underscores just how acute the physical shortage has become (FT, Bloomberg).
What began as a localized squeeze has now spilled into global markets. ETF inflows have surged, industrial users are stockpiling metal, and speculators are rushing to close leveraged short positions before borrowing costs spiral further. Market makers in London—normally the hub of over-the-counter settlement for silver—are struggling to locate deliverable bars, raising fears of settlement failures or forced cash closeouts if the situation worsens. Analysts say the squeeze has entered a feedback loop: dwindling supply fuels panic buying, which tightens supply even further. The last time London faced a comparable crunch was during the 1980 Hunt Brothers episode, but today’s stress is amplified by industrial demand from solar and electronics producers, plus rising retail hoarding amid inflation hedging. Some banks now warn that without a liquidity intervention, the market could stay “in a state of seizure” for weeks (MarketWatch).
Sensei’s Insight: London’s scramble exposes a deeper fragility in global precious-metal plumbing — a reminder that paper markets depend on physical availability. If tightness spreads to COMEX in New York, U.S. traders could face similar margin stress and delivery constraints, echoing 2021’s “silver squeeze” on a far larger scale. For investors, this is a double-edged setup: short-term volatility is extreme, but structural supply deficits—driven by industrial demand and weak mining output—may keep silver elevated long after the squeeze subsides.
🛠 China–U.S. Trade War Escalates: Tariffs, Retaliation & Maritime Tensions
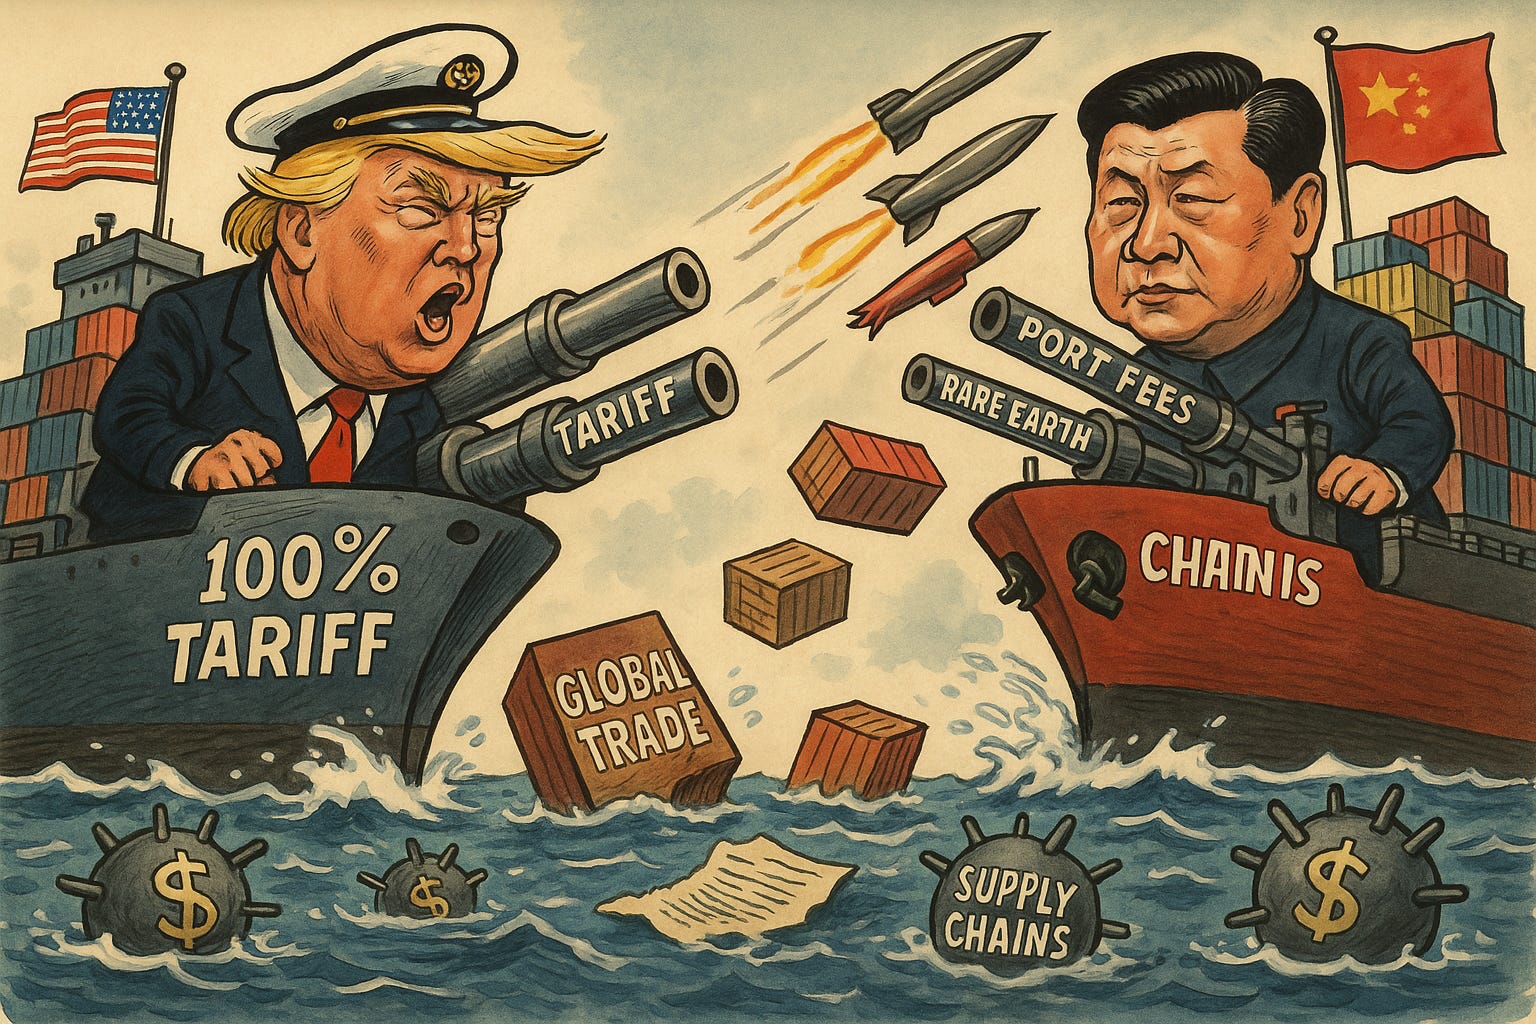
The Trump administration has declared plans to impose 100% tariffs on imports from China effective November 1, citing Beijing’s new restrictions on rare-earth exports and other strategic goods. In turn, China has vowed to retaliate and already begun countermeasures: it has imposed special port fees on U.S.-linked ships and sanctioned U.S. subsidiaries of South Korea’s Hanwha Ocean for aiding American trade probes. The two countries have effectively begun applying symmetrical maritime levies on each other’s vessels (Reuters).
These moves come against a backdrop of a broader trade escalation. China is defending its rare-earth controls as lawful and insists that Washington “rectify its erroneous practices” or risk “resolute measures.” Meanwhile, both sides have begun imposing port fees: China’s extra charges apply to U.S.-owned, built, or flagged ships (with exemptions for Chinese-built vessels), while the U.S. introduced reciprocal levies on China-linked shipping lines to de-emphasize China’s dominance in global maritime logistics (Reuters).
Sensei’s Insight: The conflict has expanded beyond goods and tariffs into shipping and logistics infrastructure—a new front in statecraft. For investors, that means disruptions to global trade flows, cost pressures on exporters and importers, and increased tail risk for supply chains. Watch for widening shipping cost spreads, jolts in freight indices, and early signs of counterparty stress among logistics firms. If the U.S. and China stay on this path, the trade war could broaden into a structural realignment of global maritime power and industrial flows.
📈 Earnings Season Kicks Off: The Market’s Reality Check
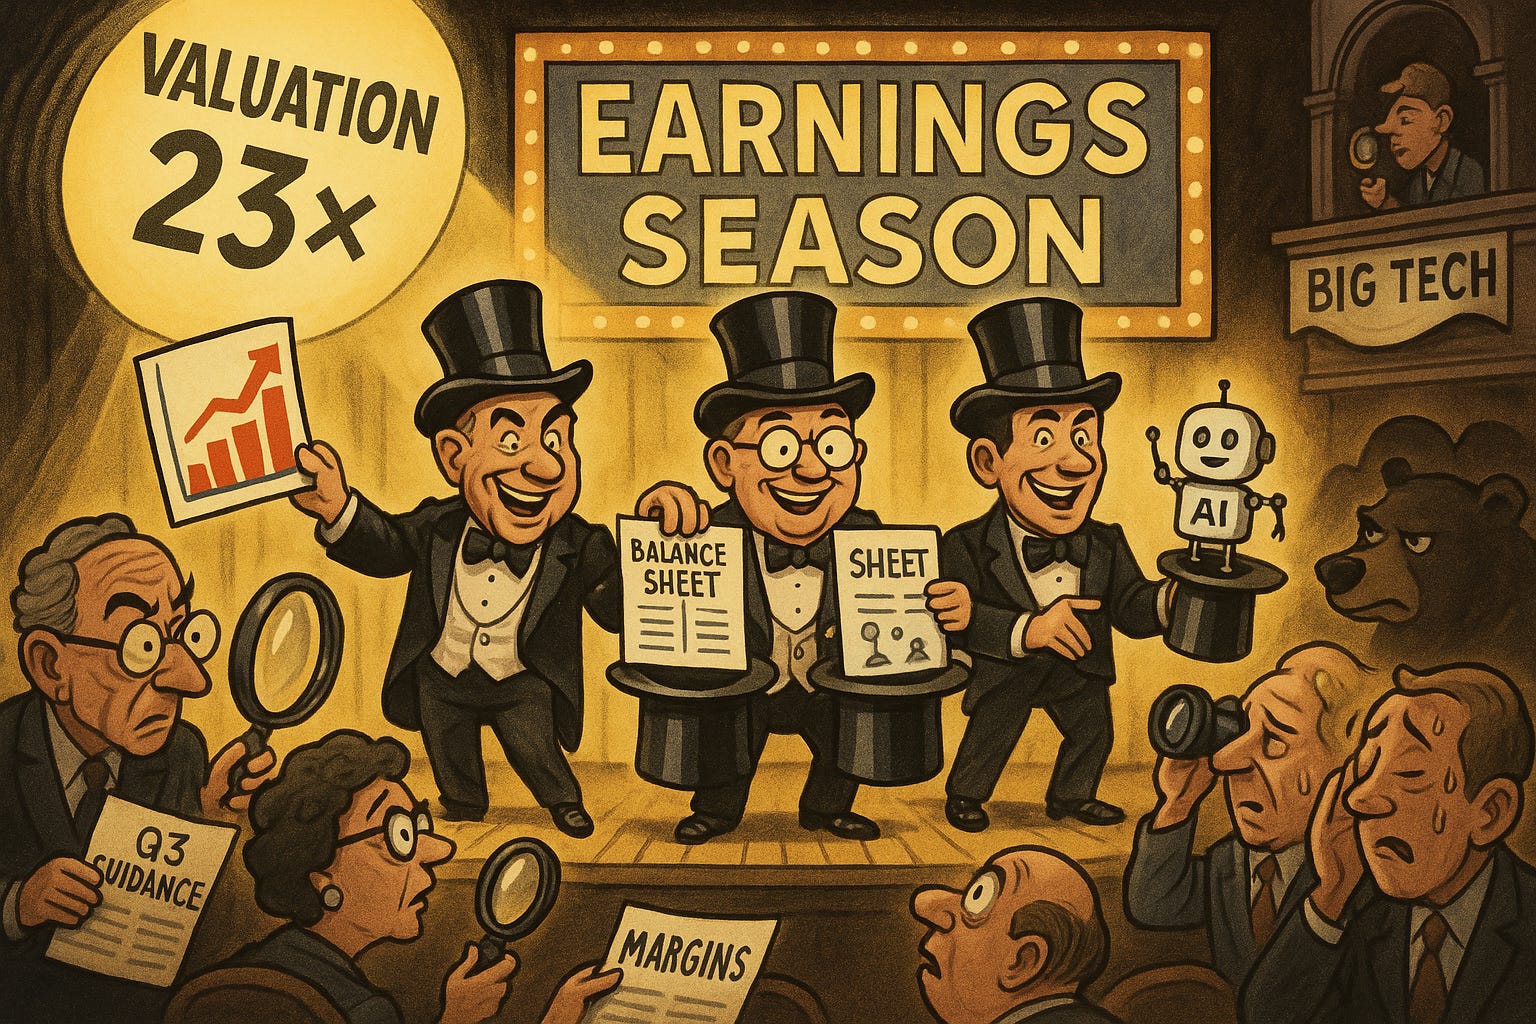
The Q3 earnings season is now in full swing — and this one matters more than most. After months of multiple expansion and AI-fueled optimism, corporate America faces a reality check. The S&P 500 is trading around 23× forward earnings, near its most expensive level in two decades outside of the pandemic, while tech and AI giants account for the bulk of 2025’s market gains. Investors now want proof that profits — not just promises — can sustain those valuations. Analysts expect overall S&P 500 earnings to grow ~6–8% year-on-year, led by technology, energy, and select industrials, but even small misses could shake confidence in the bull case (Barron’s, Reuters).
Beyond headline growth, markets will be laser-focused on forward guidance, margins, and pricing power. The recent surge in oil prices, tariff tensions between the U.S. and China, and a weakening consumer backdrop in both economies have made it harder for companies to maintain profitability. Firms that show resilient margins and credible cost control will be rewarded, while those hinting at demand softness risk sharp drawdowns. Analysts also highlight that earnings breadth — how many companies beat expectations across sectors — will matter as much as the size of the beats themselves. A narrow rally led by a handful of mega-caps could reinforce concerns that the market’s foundation is too concentrated. For now, traders are watching banks, semiconductors, and industrials for early reads on both global demand and capital expenditure trends (Goldman Sachs).
Sensei’s Insight: This is the make-or-break stretch for market credibility. If corporate earnings confirm that growth is broadening beyond big tech, the rally could gain durability — validating elevated multiples. But if results disappoint or guidance turns defensive, expect volatility and possible valuation compression across high-beta sectors. In short, this earnings season isn’t just about growth — it’s about proof of substance
₿ Metaplanet’s Market Value Falls Below Its Bitcoin Holdings — Bargain or Warning Sign?

Japan’s Metaplanet Inc., often dubbed “Asia’s MicroStrategy,” now trades at an enterprise value below the value of its Bitcoin holdings, a rare inversion that raises tough questions about investor confidence in crypto-treasury business models. The firm owns more than 30,000 BTC—worth roughly $3.4 billion—but its stock has fallen over 70% since mid-June, pulling its market-to-NAV ratio to 0.99, meaning the market now values the entire company at less than the Bitcoin it holds. Shareholders recently approved a plan to issue preferred shares to fund additional Bitcoin purchases, but that dilution risk and concerns over sustainability appear to have overshadowed the bullish optics of accumulation (Bloomberg).
At first glance, trading below net Bitcoin value might look like a “no-brainer” buy—a chance to acquire BTC exposure at a discount. But the valuation gap reflects deeper investor caution. Markets are pricing in governance risk, dilution from future share issuance, and the possibility that Metaplanet’s business structure introduces costs or constraints that direct Bitcoin ownership doesn’t. Unlike holding BTC outright, owning Metaplanet stock exposes investors to management execution, funding costs, Japanese regulatory treatment of crypto assets, and potential liquidation barriers. Similar patterns have been seen before: MicroStrategy has periodically traded below its implied BTC NAV during risk-off phases, only to recover when sentiment toward Bitcoin and corporate treasuries improved.
Sensei’s Insight: Metaplanet’s discount highlights the market’s shift from narrative to balance-sheet realism. For contrarian investors, it’s tempting—buying shares worth less than the assets they represent. But discounts like this often signal liquidity, governance, or confidence risk, not just opportunity. If Bitcoin stabilizes and Metaplanet reins in dilution, the discount could narrow sharply. Until then, it serves as a reminder: in crypto-linked equities, asset exposure isn’t the same as asset value—and the gap between the two can be as revealing as any price chart.
🔗 Connect with Us
Stay plugged in across platforms:
Sensei on X: sensei_crypto_
Martyn Lucas on X: MartynInvestor
Vaz on X: eVTOLHUB
💎 Premium Discord Access: Join the Discord
📺 YouTube Channel (Live & Replays): Martyn Lucas Investor
👕 Limited Merch: Shop Here

🔍Deep Dive —Inside Powell’s Dilemma — No Data, Divided Fed, Nervous Markets
Keep reading with a 7-day free trial
Subscribe to Sensei.news to keep reading this post and get 7 days of free access to the full post archives.